
Page 138 - The-5th-MCAIT2021-eProceeding
P. 138
Sifei Lu et al. (2017) attempt to estimate house price in Ames by using Lasso and Gradient Boosting Decision
Tree. House price forecast based on house characteristics and location which is find out that GBDT produces
better model capabilities than Lasso. Study conducted by Nissan, Pow, Emil Janulewics & Liu (2015) prove
that k-NN and Random Forest show excellent performance compared to linear regression. k-NN is the best
model with the lowest square error rate. Their study is using the data set which is extracted from the centris.ca
website.
3. Material and Method
Random Forest (RF), Gradient Boosting Decision Tree (GBDT) and k-Nearest Neighbors (k-NN) were
applied for regression and comparison between them for the most accuracy model. After the analysis,
conclusion and the recommendations have been write up to provide the output
3.1 Data Pre-Processing
In this study, Scikit-Learn and Microsoft Excel are being used as a machine learning tools to perform pre-
processing tasks. In a data cleaning process, there is data missing and not filled in certain attribute lines. The
solution is taken to manually fill in Excel. Missing data is fill in with the median value. In this study, the missing
data on attributes that require filling in the median values are atribut luas_lot, luas_lot bangunan and b_tingkat.
There are also attributes that have noise data where the data is filled in with incorrect or unreasonable values.
The attribute is b_tingkat. Data reduction is made so that the remaining values are correct. There are also
attributes that have no value in some lines and have no relation to other attributes such as the keadaan_bgn
attribute. The solution is also to delete the data from the data record. There are 44 records of noise and irrelevant
data where these records are being deleted. The data in the data set also goes through the process of data
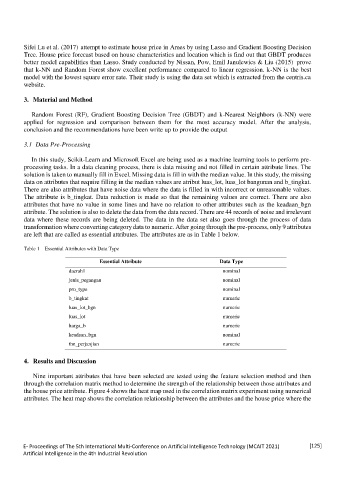
transformation where converting category data to numeric. After going through the pre-process, only 9 attributes
are left that are called as essential attributes. The attributes are as in Table 1 below.
Table 1 Essential Attributes with Data Type
Essential Attribute Data Type
daerah1 nominal
jenis_pegangan nominal
pro_type nominal
b_tingkat numeric
luas_lot_bgn numeric
luas_lot numeric
harga_b numeric
keadaan_bgn nominal
thn_perjanjian numeric
4. Results and Discussion
Nine important attributes that have been selected are tested using the feature selection method and then
through the correlation matrix method to determine the strength of the relationship between those attributes and
the house price attribute. Figure 4 shows the heat map used in the correlation matrix experiment using numerical
attributes. The heat map shows the correlation relationship between the attributes and the house price where the
E- Proceedings of The 5th International Multi-Conference on Artificial Intelligence Technology (MCAIT 2021) [125]
Artificial Intelligence in the 4th Industrial Revolution