
Page 139 - The-5th-MCAIT2021-eProceeding
P. 139
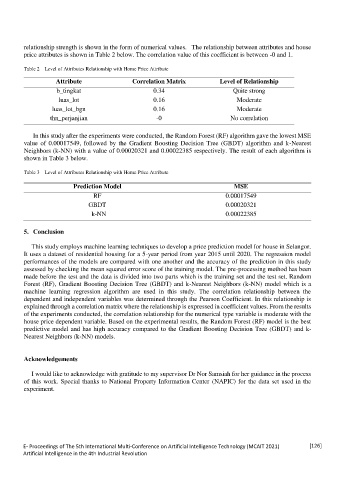
relationship strength is shown in the form of numerical values.   The relationship between attributes and house
        price attributes is shown in Table 2 below. The correlation value of this coefficient is between -0 and 1.

        Table 2    Level of Attributes Relationship with Home Price Attribute

                  Attribute               Correlation Matrix         Level of Relationship
                  b_tingkat                     0.34                     Quite strong
                   luas_lot                     0.16                      Moderate
                 luas_lot_bgn                   0.16                      Moderate
                thn_perjanjian                   -0                     No correlation

           In this study after the experiments were conducted, the Random Forest (RF) algorithm gave the lowest MSE
        value  of  0.00017549,  followed  by  the  Gradient  Boosting  Decision  Tree  (GBDT)  algorithm  and  k-Nearest
        Neighbors (k-NN) with a value of 0.00020321 and 0.00022385 respectively. The result of each algorithm is
        shown in Table 3 below.

        Table 3    Level of Attributes Relationship with Home Price Attribute

                        Prediction Model                                 MSE
                              RF                                      0.00017549
                            GBDT                                      0.00020321
                              k-NN                                    0.00022385

        5.  Conclusion

           This study employs machine learning techniques to develop a price prediction model for house in Selangor.
        It uses a dataset of residential housing for a 5-year period from year 2015 until 2020. The regression model
        performances of the models are compared with one another and the accuracy of the prediction in this study
        assessed by checking the mean squared error score of the training model. The pre-processing method has been
        made before the test and the data is divided into two parts which is the training set and the test set. Random
        Forest (RF), Gradient Boosting Decision Tree (GBDT) and k-Nearest Neighbors (k-NN) model which is a
        machine  learning  regression  algorithm  are  used  in  this  study.  The  correlation  relationship  between  the
        dependent and independent variables was determined through the Pearson Coefficient. In this relationship is
        explained through a correlation matrix where the relationship is expressed in coefficient values. From the results
        of the experiments conducted, the correlation relationship for the numerical type variable is moderate with the
        house price dependent variable. Based on the experimental results, the Random Forest (RF) model is the best
        predictive model and has high accuracy compared to the Gradient Boosting Decision Tree (GBDT)  and k-
        Nearest Neighbors (k-NN) models.


        Acknowledgements

           I would like to acknowledge with gratitude to my supervisor Dr Nor Samsiah for her guidance in the process
        of this work. Special thanks to National Property Information Center (NAPIC) for the data set used in the
        experiment.


        E- Proceedings of The 5th International Multi-Conference on Artificial Intelligence Technology (MCAIT 2021)   [126]
        Artificial Intelligence in the 4th Industrial Revolution